Too busy running a business for our tools
I was asked how to get more data out of the sales agents already on the platform. I changed the question to why most of them weren’t there, and found they were too busy running their businesses to use it. The roadmap turned toward helping them run those businesses, and I redesigned how the organization decides what to fund.
- Role
- Staff Product Designer(Service Design and Design Strategy)
- Scope
- Across business units and functions of a ~250-person product org, from field research with sales agents to portfolio-level investment strategy
- Team
- Solo IC who built a working team for each initiative: head of design, senior UX researcher, senior product designer, staff product manager, head of engineering
- Industry
- Agriculture
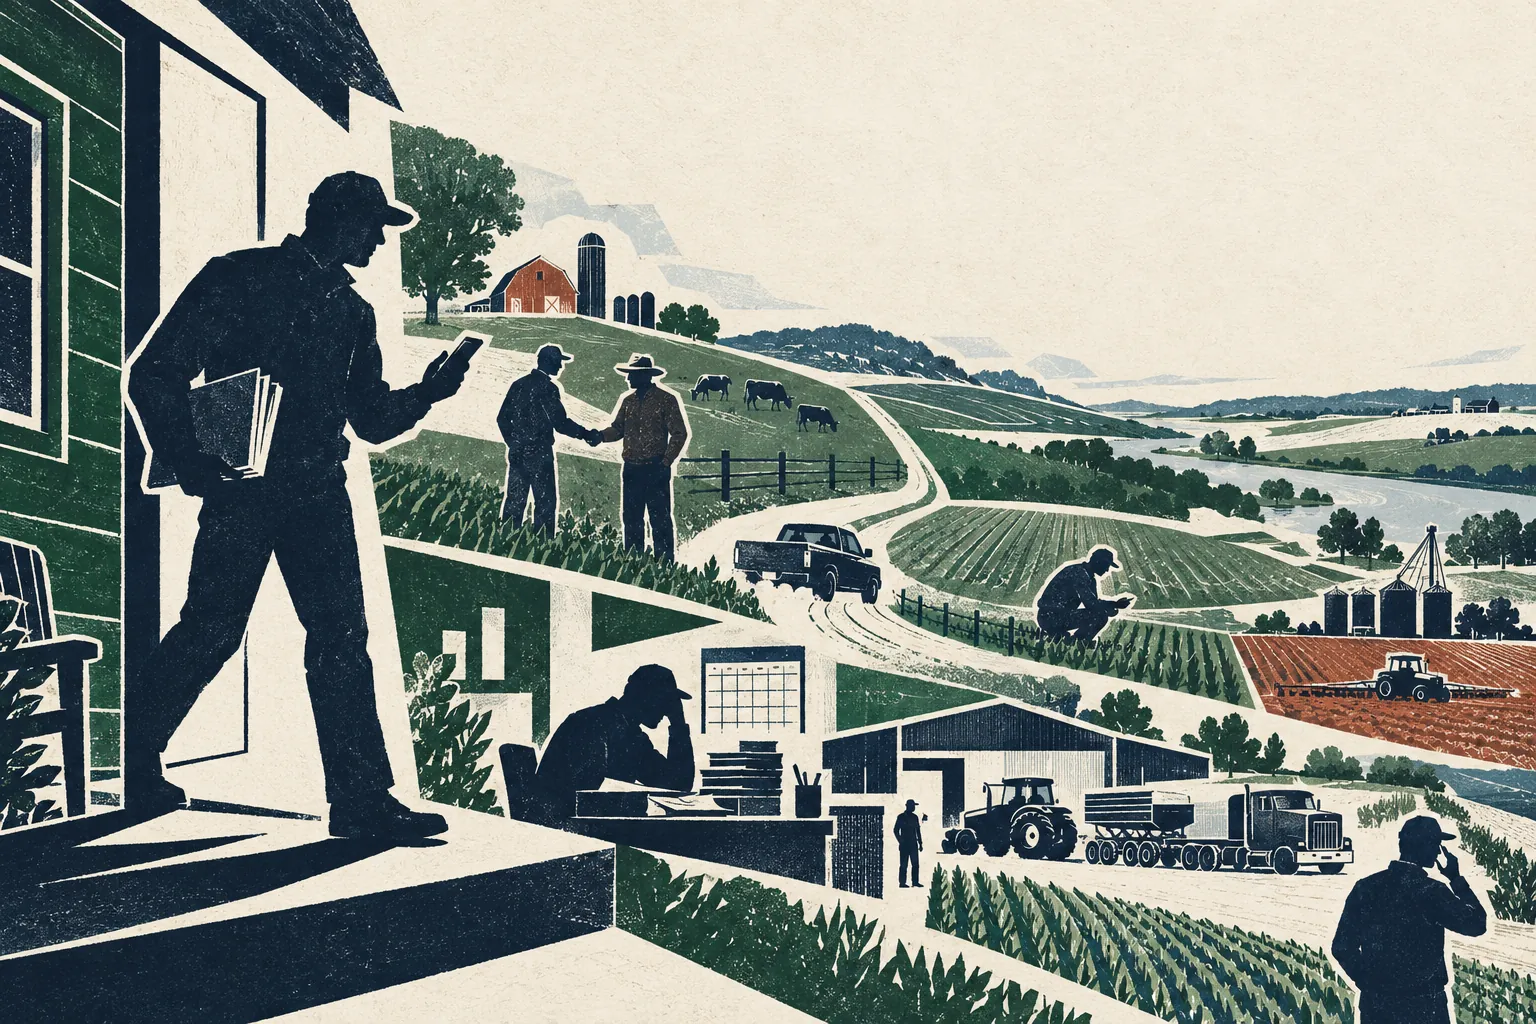
As I sat watching the video tiles fill, I wondered whether this would be the meeting where the engagement number finally got the attention it deserved. The slide came, and just as quickly we moved on. Engagement sat in the low 30s percent, and the conversation turned to data collection.
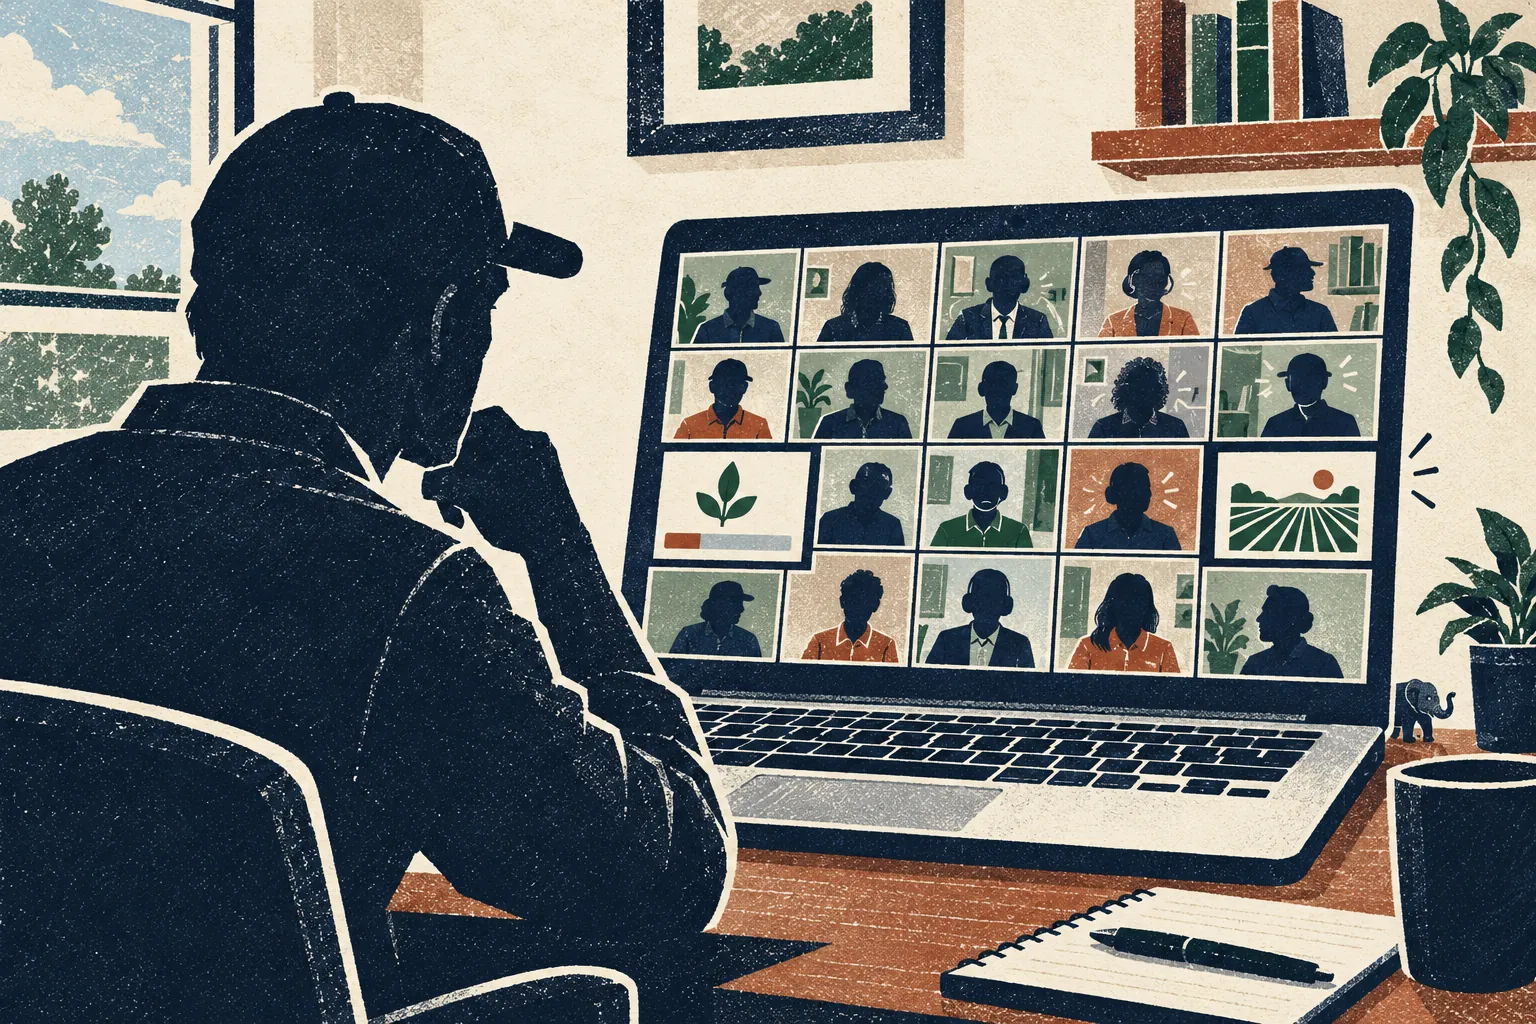
Our sales agents are independent businesspeople who sell our seed to farmers. The platform kept asking them for more on-farm data, and why most of them weren’t using it got far less attention. We were designing more work for people who barely had time for their customers.
I spent months mapping sales agents’ journeys before accepting there was no repeatable path: weather, disease and prices turned into farmer calls that couldn’t wait. One agent, working 80 to 100 hours a week at peak season, told me he takes those calls standing in his kitchen in the middle of the night, because a missed call can mean a lost sale. I switched to jobs-to-be-done, betting that designing for the outcomes agents were trying to reach would serve them better than forcing their days into a flow. It cost us familiarity, because people knew journey maps.
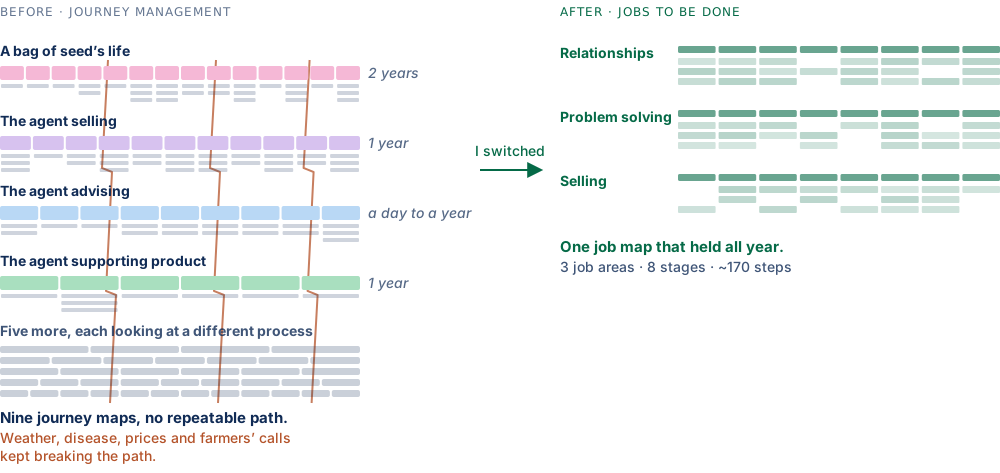
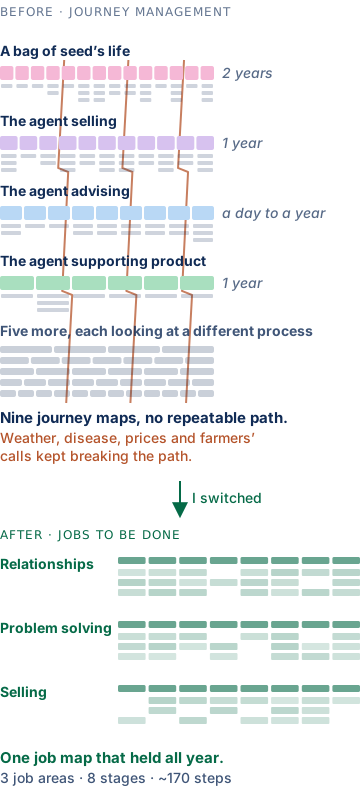
See the original journey maps
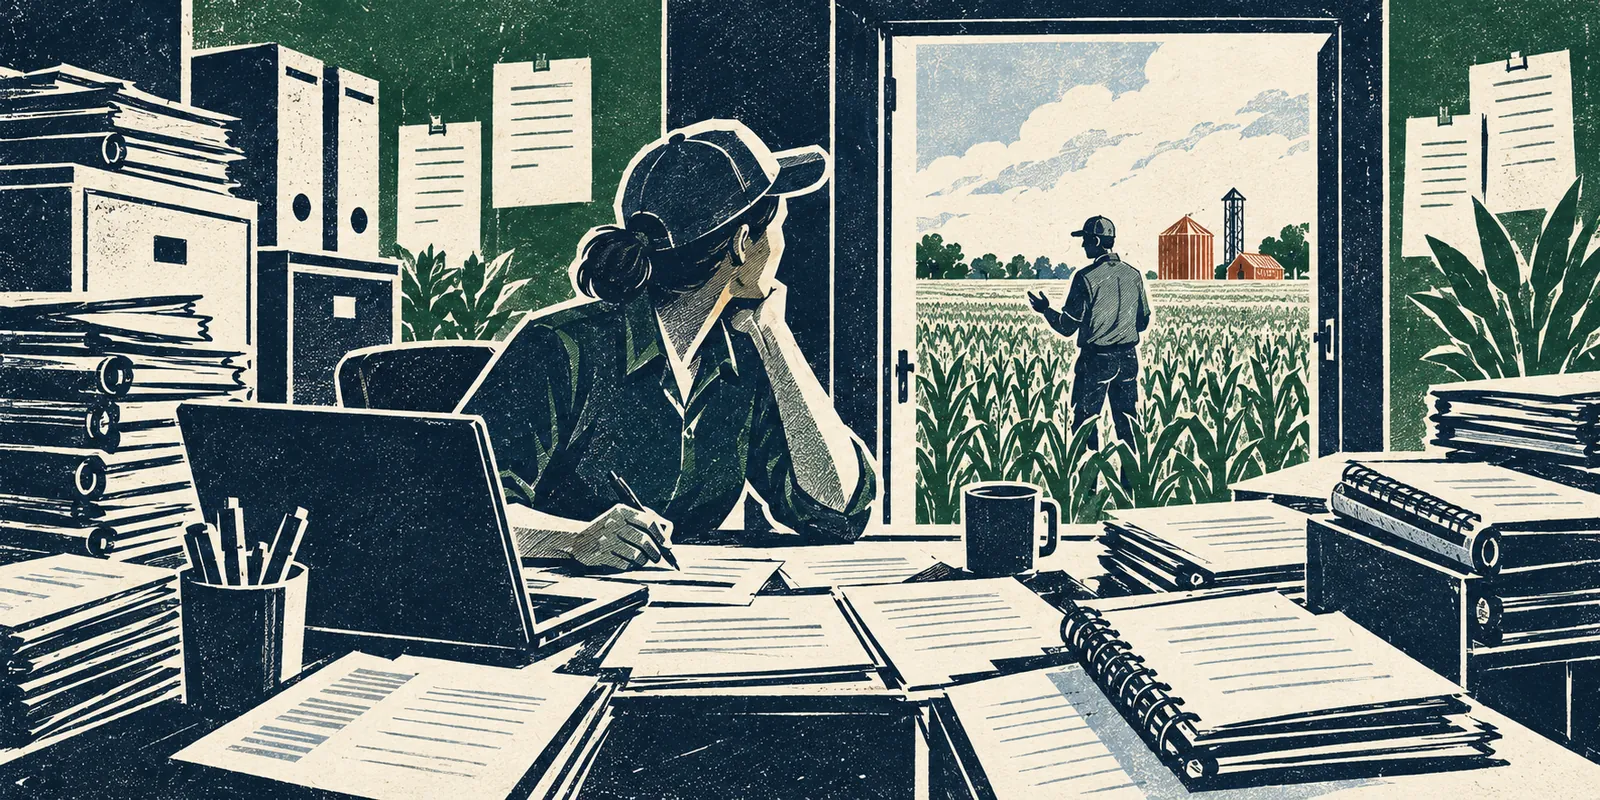
My research kept pointing past the field work. Agents were running independent agencies, and we weren’t helping with that side at all. When I read our commercial team’s push to consolidate agencies, I could see the administrative load coming, and I started steering our work toward the business each agent was running.
Planning ran on documents passed around, and its lens stopped at the edge of our software. I founded a Design Strategy Center of Excellence, helped build a shared list linking our features and capabilities to agents’ jobs, and redesigned annual planning around those jobs.
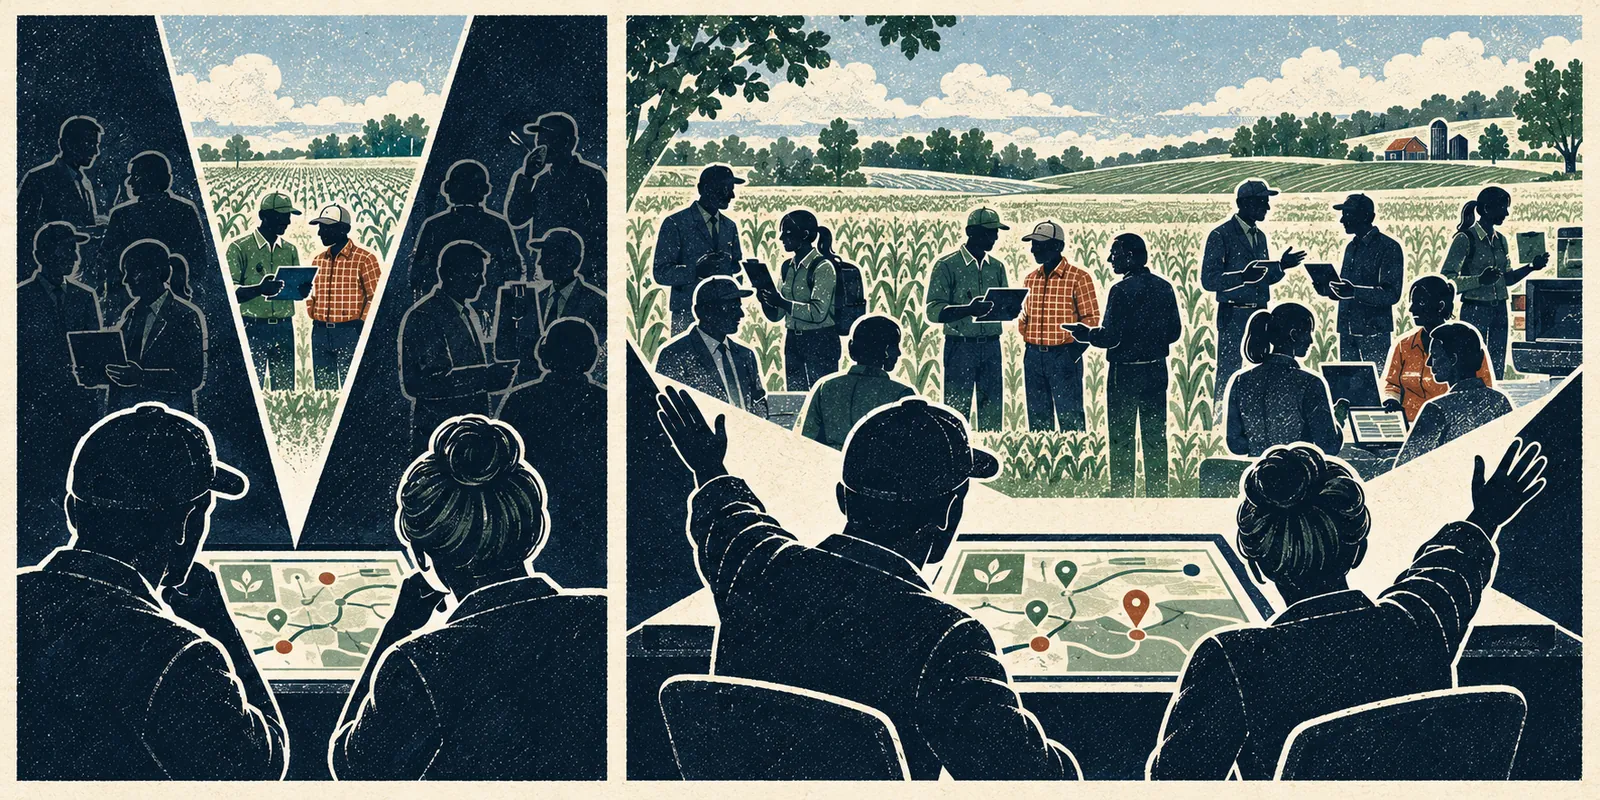
I mentored my manager, a senior designer and a senior researcher so they could carry the work into rooms I wasn’t in. Then I took the process to the senior leadership team. They approved it, and I facilitated it: two days inside a sales agent’s world before anyone argued for a technology. I designed it as a first step rather than a dramatic shift, so the organization could start thinking in jobs without rejecting an approach that didn’t match how it already worked. I’d planned a survey to find which jobs had the biggest unmet needs, so the day could focus there. We ran out of time, and the room brainstormed more broadly than I’d hoped, so afterwards I synthesized its output with customer data to see which investments would have the biggest impact.
The planning work as a system
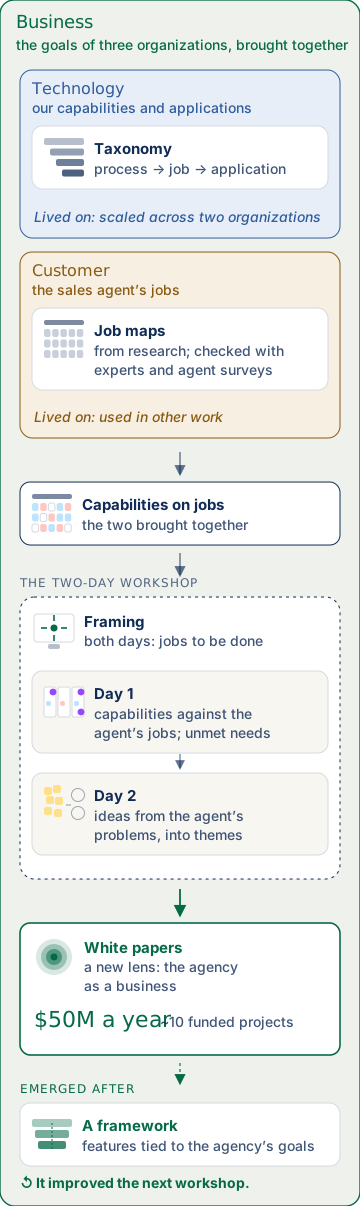
- 34
- people
- 4
- cross-functional groups
- 6
- working boards
- 3
- job areas, 5 main jobs
- 8
- stages per job
- ~170
- job steps mapped
- ~300
- ideas
See the workspaces
The white papers from that cycle widened the roadmap to the agent’s whole territory and agency. I followed with research into which parts of running an agency needed the most help, and built a framework that tied our features to the goals of the agency, to sharpen the next year’s planning. From then on, the process decided where $50M a year went, about ten funded projects. Engagement later closed at 44% against a goal of 35%. With our UX research manager and analytics lead, I reshaped measurement around jobs. The following year, the quarterly survey (about 1,400 respondents) showed perceived success up 13%, trust up 11% and satisfaction up 6%.
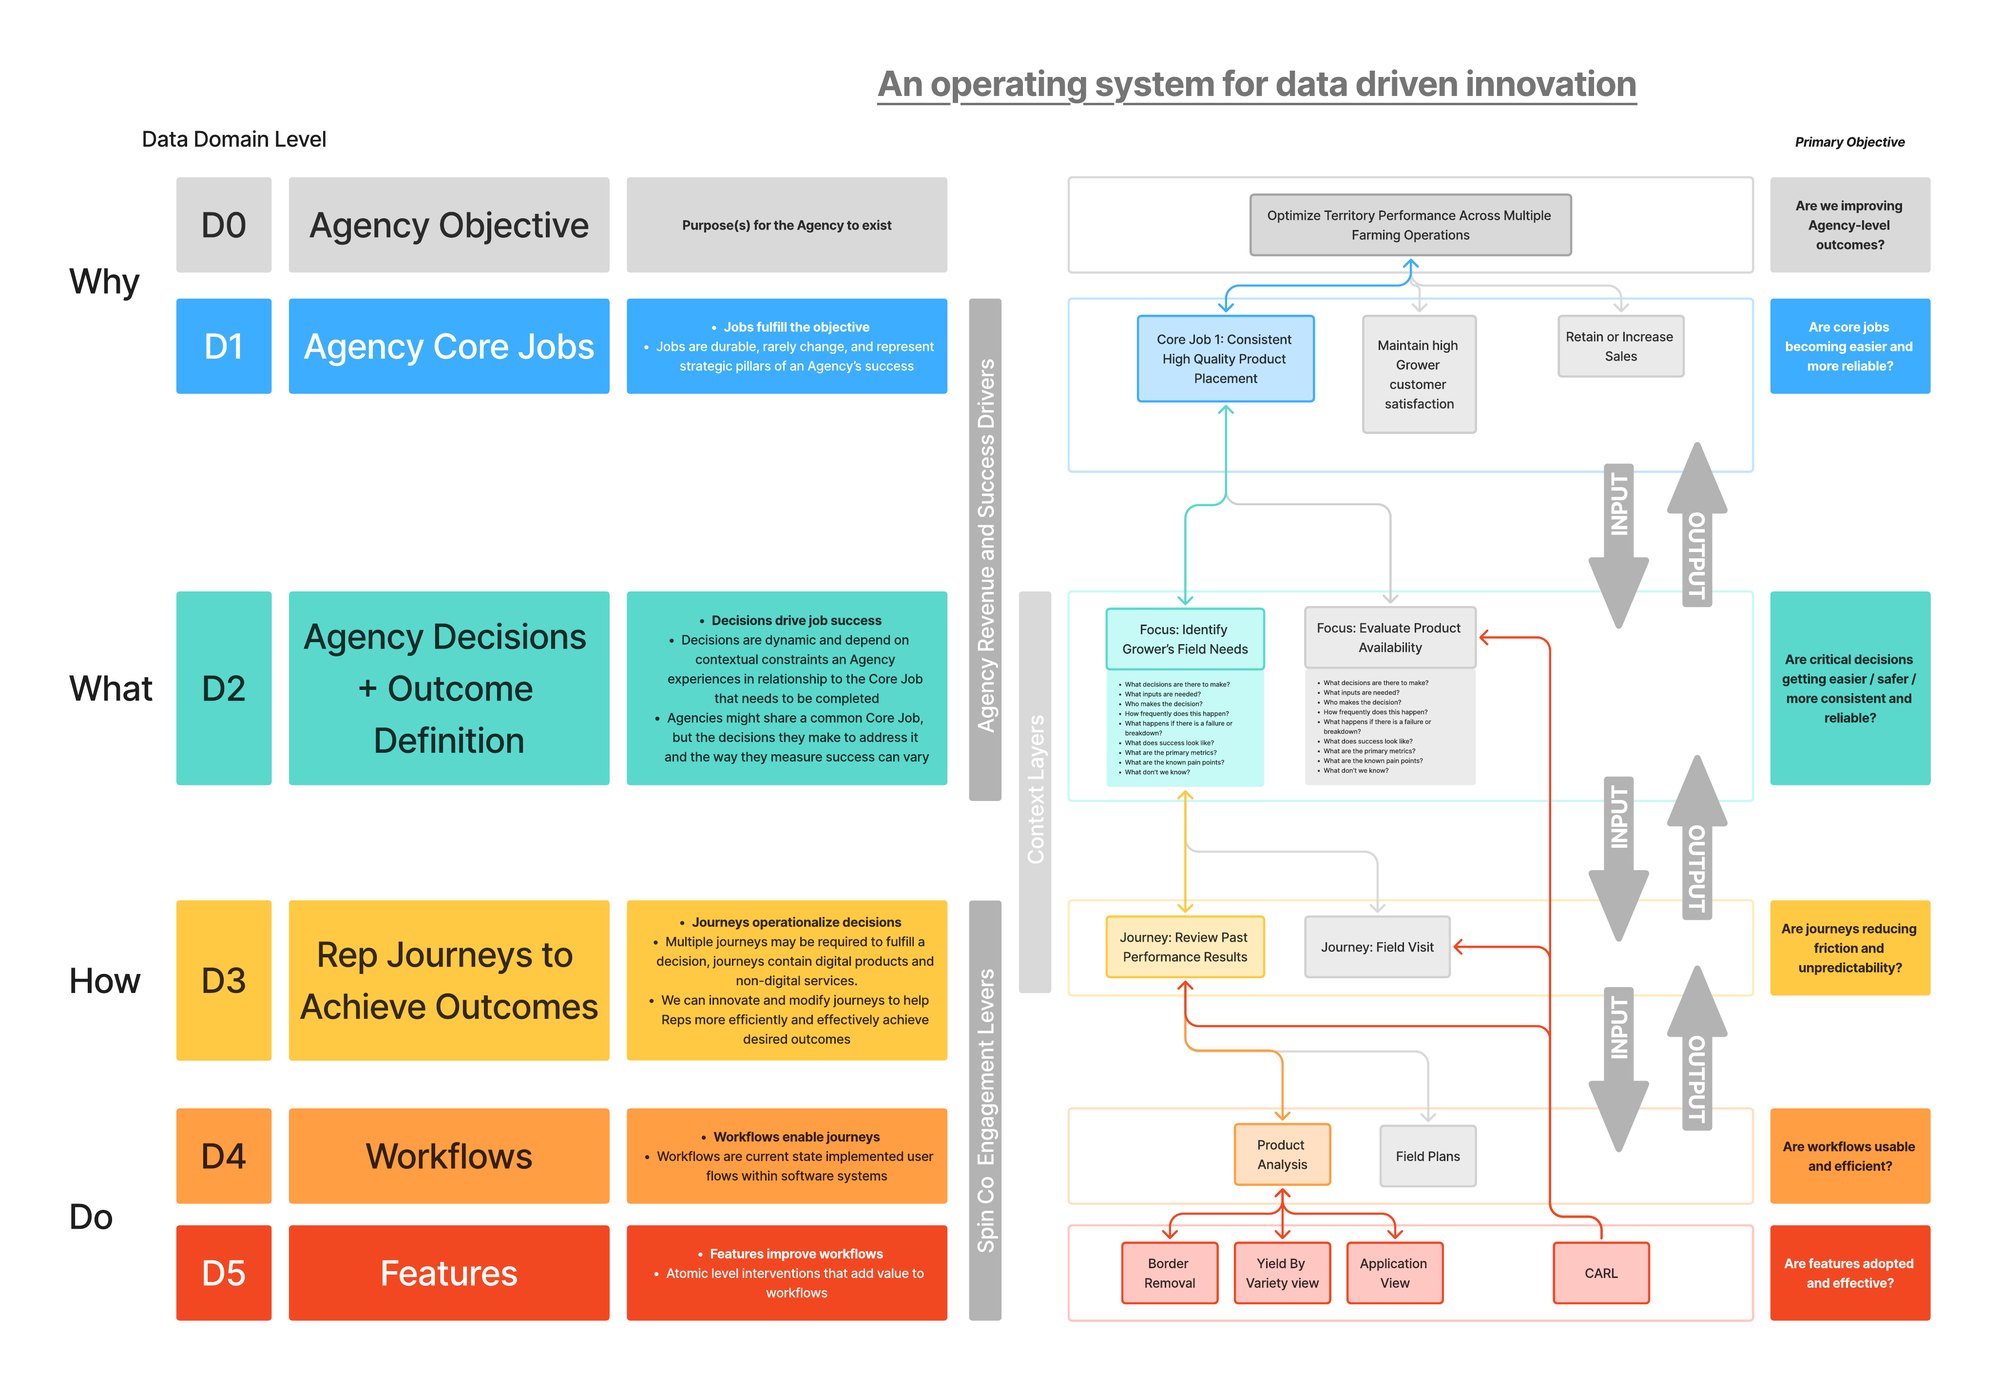
People move through the world in messy, nonlinear ways, and software tends to solve problems as if they don’t. Part of the work is making that mess comfortable to adopt.
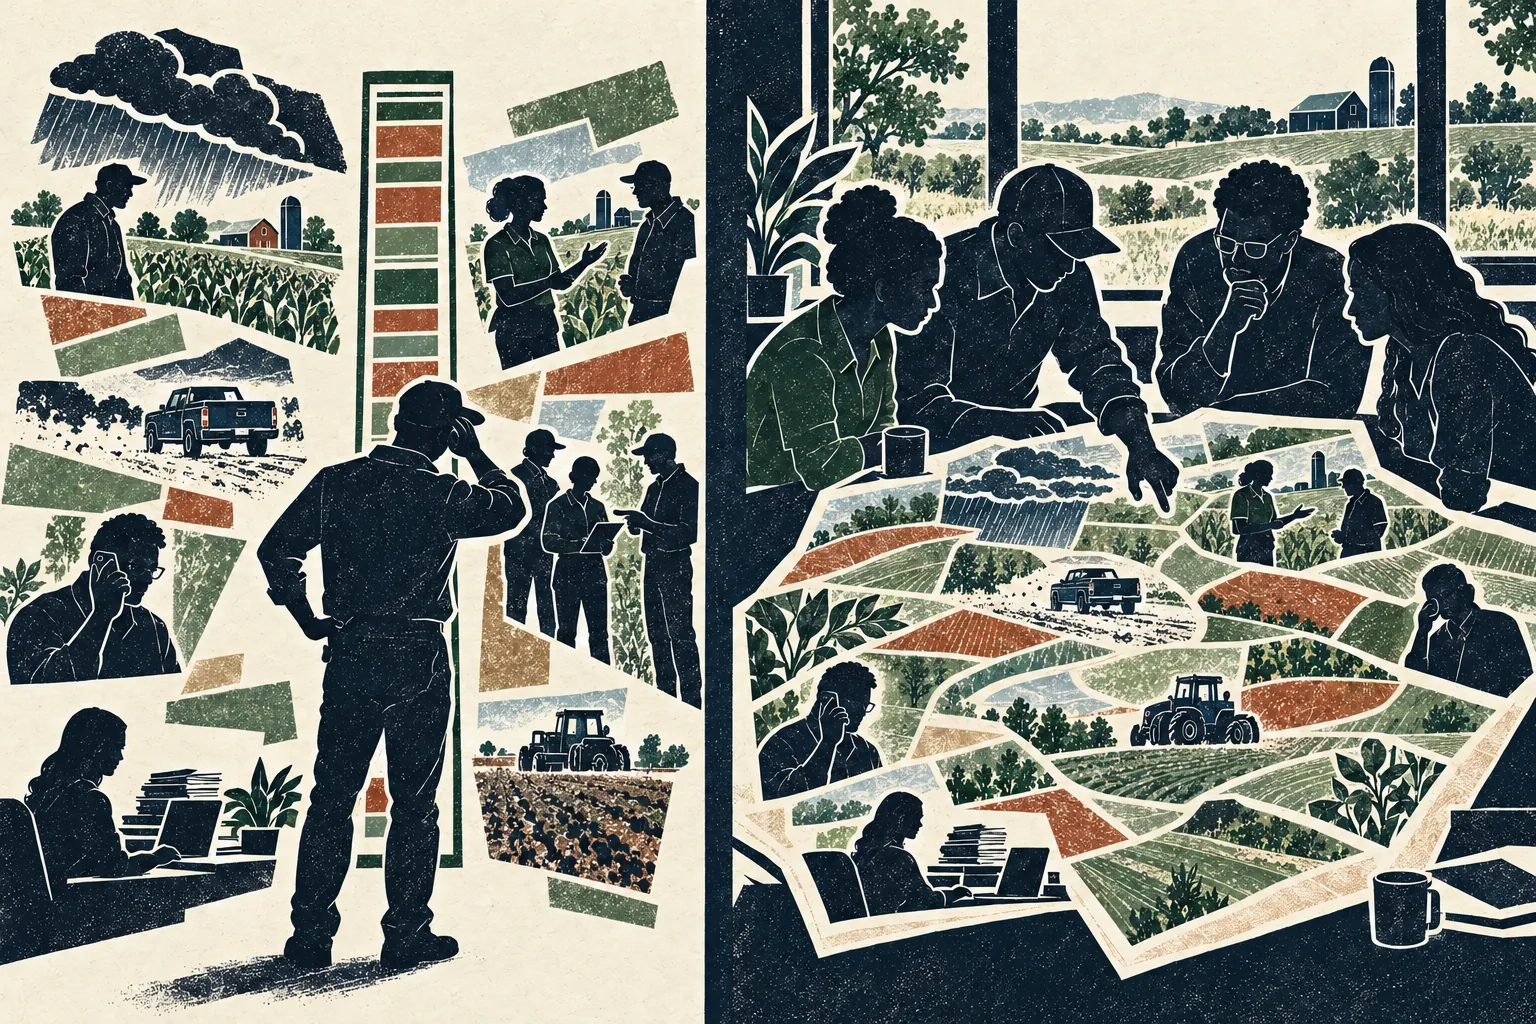
Illustrations made with AI, and an exhaustive amount of art direction by Peter Sharp.